Before you start
About this guide
This e-book is written for people taking their first steps in Forex. You don't need any prior experience: every concept is explained from scratch, with worked numbers and diagrams.
Beginners who want to understand how the currency market works before risking real money, and traders who want to organise what they already know.
Read the chapters in order: each one prepares the next. Redo the examples on a demo account and use the checklists before every trade.
How to read the highlights
Extra explanations and context.
Good practices that save time and money.
Common mistakes and risks you should know before trading.
Trading Forex and CFDs carries a high risk of loss. This guide is educational, not financial advice: only trade with money you can afford to lose.
Start at the beginning
Forex is open to anyone with an internet connection. That is an opportunity, and also the reason so many beginners jump in unprepared.
Today, opening an account with an online broker takes a few minutes, and some let you start with small deposits. Easy access, however, does not make the market any simpler. A currency's price reacts to interest rates, inflation, politics and the behaviour of millions of participants, and leverage magnifies both gains and losses.
This guide does not promise quick riches. The goal is to give you a solid foundation: understanding what you are buying, how much you are risking and why, before you put real money in the market.
By the end of this guide you will be able to
- Read a quote and identify the base and quote currencies
- Calculate pips, pip value and lot size
- Explain how leverage and margin work
- Recognise the most active sessions of the day
- Tell fundamental and technical analysis apart
- Read candles, trend, support and resistance
- Size a position based on risk
- Assess a broker before you deposit
Realistic expectations
| Myth | Reality |
|---|---|
| “With a good strategy you always win.” | Losses are part of the process. What sets a consistent trader apart is losing little when wrong. |
| “Leverage will make me rich faster.” | Leverage speeds up results in both directions. Without risk management, it mostly speeds up losses. |
| “Indicators tell me what will happen.” | Indicators summarise what has already happened. They help organise a decision, not predict the future. |
| “I need to trade every day.” | Waiting for the right setup is a decision. Many days without a trade are well-managed days. |
Read the guide once to get the big picture. Then go back to chapters 2, 3 and 9: they are the basis of every calculation.
What is Forex
The world's largest financial market, where the currencies of different countries are exchanged, 24 hours a day on weekdays.
Forex stands for foreign exchange. Whenever a company pays a supplier in another country, a tourist changes money or a central bank intervenes in its currency, a currency exchange takes place. The Forex market is the global network where those exchanges happen.
Unlike a stock exchange, Forex has no central building. It is an over-the-counter (OTC) market: banks, brokers and electronic platforms trade directly with one another. That is why the market runs continuously from Monday to Friday, following the sun from one financial centre to the next.
According to the Bank for International Settlements (BIS) Triennial Survey of 2022, average Forex turnover was around 7.5 trillion US dollars per day. That makes it the most liquid financial market in the world.
Who takes part in the market
Set interest rates and can intervene in their currency. Their decisions are among the events that move the market most.
Account for most of the volume. They trade on their own account and on behalf of clients.
Exchange currency to pay for imports, receive export income or hedge against currency swings.
Invest across countries and adjust their currency positions according to their strategy.
Give retail clients access to the market, usually through online platforms and CFDs.
Individuals, like you, who speculate on currencies rising or falling.
Much of today's volume is speculative: participants buy and sell currencies to profit from price changes, not to pay for goods or services.
Why a currency's price changes
An exchange rate is the price of one currency measured in another. That price rises when there is more interest in buying than selling, and falls in the opposite case. The useful question is: what makes people want more or less of a currency?
The main drivers
| Factor | How it usually affects the currency |
|---|---|
| Interest rates | Higher rates attract capital seeking yield, which increases demand for the currency. |
| Inflation | Persistent inflation erodes purchasing power. The effect depends on the central bank's response: raising rates to fight it can even strengthen the currency in the short term. |
| Economic growth | Strong jobs, spending and output data point to a healthy economy and more investment. |
| Risk and confidence | In fearful periods, capital tends to seek safe-haven currencies such as the US dollar, the Swiss franc and the yen. |
| Foreign trade | Countries that export a lot receive foreign-currency payments that they convert into the local currency. |
The market reacts to the gap between what was expected and what happens. “Good” economic data can push a currency down if the market expected an even better number.
Open a free Deriv demo account and follow these moves without risking money.
How to read a quote
Currency pairs, buying and selling, spread, pips and lots: the language you will use in every trade.
The currency pair
In Forex, currencies are always traded in pairs. The quote tells you how much of the second currency you need to buy one unit of the first.
If EUR/USD rises from 1.0850 to 1.0900, the euro has strengthened against the dollar: you now need more dollars to buy one euro. If it falls, the euro has weakened.
Buying or selling a pair
You expect the base currency to strengthen against the quote currency. You profit if the price rises.
You expect the base currency to weaken. You profit if the price falls. You don't need to own the currency to sell it.
Types of pairs
| Type | Examples | Characteristics |
|---|---|---|
| Majors | EUR/USD, USD/JPY, GBP/USD, USD/CHF, AUD/USD, USD/CAD, NZD/USD | Include the US dollar. The most traded pairs, usually with the lowest spreads. |
| Crosses (minors) | EUR/GBP, EUR/JPY, GBP/JPY, AUD/NZD | Two strong currencies without the dollar. Good liquidity, slightly wider spreads. |
| Exotics | USD/ZAR, USD/TRY, EUR/PLN, USD/MXN | A major currency paired with an emerging-market currency. Wider spreads and sharper moves. |
Bid, ask and spread
Your broker always shows two prices. You buy at the higher price and sell at the lower one. The difference between them is the spread, the main cost of a trade.
In practice, when you open a buy trade it starts slightly negative: the price has to rise by at least the spread for you to break even. Spreads tend to widen during low-liquidity hours and around major news.
The pip: the unit of measurement
A pip is the standard price increment. On most pairs it is the fourth decimal place (0.0001). On pairs with the Japanese yen it is the second (0.01). Many platforms also show an extra digit called a pipette (a tenth of a pip).
| Pair | Move | Pips |
|---|---|---|
| EUR/USD | 1.0850 → 1.0875 | +25 |
| GBP/USD | 1.2700 → 1.2640 | −60 |
| USD/JPY | 150.20 → 150.65 | +45 |
The lot: position size
Trade size is measured in lots. The bigger the lot, the more each pip is worth.
| Lot | Units of base currency | Approximate pip value* |
|---|---|---|
| Standard (1.00) | 100,000 | 10 USD |
| Mini (0.10) | 10,000 | 1 USD |
| Micro (0.01) | 1,000 | 0.10 USD |
* For pairs where the US dollar is the quote currency (EUR/USD, GBP/USD, AUD/USD…). On other pairs the pip value changes with the exchange rate; your broker's platform calculates it automatically.
EUR/USD, 1 standard lot: 0.0001 × 100,000 = 10 USD per pip
A trade from start to finish
Ana believes the euro will strengthen. She buys 0.10 lot (mini) of EUR/USD at 1.0850.
- Pip value: 0.0001 × 10,000 = 1 USD per pip.
- Scenario A — price rises to 1.0900: +50 pips × 1 USD = +50 USD.
- Scenario B — price falls to 1.0820: −30 pips × 1 USD = −30 USD.
- Entry cost: with a 2-pip spread, the trade starts at −2 USD and only turns positive above 1.0852 (on the buy chart).
Bruno expects the pound to lose value. He sells 0.05 lot of GBP/USD at 1.2700. Each pip is worth 0.0001 × 5,000 = 0.50 USD.
- If the price falls to 1.2640: +60 pips × 0.50 = +30 USD.
- If the price rises to 1.2740: −40 pips × 0.50 = −20 USD.
Swap: the cost of holding a position overnight
If you keep a position open past your broker's daily cut-off time, you may pay or receive a swap (or rollover). It reflects the interest-rate difference between the two currencies in the pair and can be positive or negative. For multi-day trades, include the swap in your cost calculation.
Common mistakes in this chapter
- Confusing the number of pips with the profit in money, forgetting the lot size.
- Using 0.0001 as the pip on a yen pair instead of 0.01.
- Ignoring the spread and swap when calculating the expected result.
- Picking the lot size by eye, without knowing what each pip is worth.
Before any trade, you should be able to answer three questions: what is each pip worth, how many pips am I risking, and how much is that in money.
Leverage and margin
Leverage lets you control positions larger than your balance. It is useful, and also the most common cause of wiped-out accounts.
How it works
With leverage, the broker lets you open a large position by depositing only a fraction of its value. That fraction is set aside as collateral and is called margin.
A 10,000 USD position at 1:100 leverage → 10,000 ÷ 100 = 100 USD of margin
Note: leverage does not change the value of each pip. A 10,000 USD position is worth about 1 USD per pip with or without leverage. What changes is how much of your account that position represents.
The same move, different accounts
Imagine a 1,000 USD account and a 1% move against you in the pair's price:
| Position size | Leverage used | Loss on −1% | Account impact |
|---|---|---|---|
| 1,000 USD | 1:1 | 10 USD | −1% |
| 10,000 USD | 1:10 | 100 USD | −10% |
| 50,000 USD | 1:50 | 500 USD | −50% |
| 100,000 USD | 1:100 | 1,000 USD | −100% |
Table 3.1 — Illustrative calculation, excluding spread and costs.
A 1% move in a major pair can happen in a single day. With a fully leveraged account, that ordinary move is enough to lose the entire balance.
Available leverage vs. used leverage
A broker may offer 1:500, but that is only the maximum allowed. What counts is the size of the positions you open relative to your balance. Many regulators cap leverage for retail clients; in the European Union, for example, the limit on major pairs is 1:30.
Free margin, margin call and stop out
While you have open trades, the platform tracks your equity: your balance plus or minus open profits and losses. If equity falls too far relative to the margin in use, the broker protects itself.
The margin level is calculated as equity ÷ used margin × 100. Each broker sets the level at which it sends a warning (margin call) and the level at which it starts closing your positions (stop out). Check those values in your account before trading.
How to use leverage safely
- Decide your risk in money first, not the position size. Chapter 9 shows how.
- Always set a stop loss. That is what limits the loss, not the leverage.
- Keep plenty of free margin so that normal moves don't push you into a stop out.
- Avoid several correlated positions (for example, buying EUR/USD and GBP/USD at the same time), which in practice add up the risk.
- Prefer accounts with negative balance protection, where available, so you don't end up owing the broker after an extreme move.
Treat leverage as a capital-efficiency tool, not a profit multiplier. If you need maximum leverage for a trade to be “worth it”, the trade is probably too big for your account.
On a demo account you can watch margin and equity change in real time, with virtual money.
Forex and other markets
What makes Forex different from stocks, commodities and cryptocurrencies.
| Feature | Forex | Stocks | Crypto |
|---|---|---|---|
| Hours | 24 h, Monday to Friday | Each country's exchange hours | 24 h, 7 days a week |
| Liquidity | Very high on major pairs | High for large companies, low for small ones | Varies widely between coins |
| Structure | Decentralised (OTC) | Centralised exchanges | Many independent platforms |
| Typical costs | Spread, sometimes commission, swap | Commissions and custody fees | Spreads and platform fees |
| Leverage | Common, capped by regulators | Lower, or none | Varies; rules differ a lot |
| What moves price | Interest rates, economy, politics | Company results, sector, economy | Adoption, regulation, sentiment |
- Runs almost non-stop on weekdays
- Major pairs with low trading costs
- Ability to profit from rises and falls
- Economic news released on known dates
- High leverage makes large losses easy
- Sharp moves on news and over weekends (gaps)
- Very uneven broker quality
- Overtrading because the market is always open
Most retail clients don't buy actual currency: they trade CFDs (contracts for difference) that track the pair's price. You win or lose the difference between the opening and closing price, without receiving the currencies.
Trading sessions
Forex is open all day, but it does not move the same way at every hour.
The trading day follows the major financial centres. Each session has its own rhythm, and the periods when two sessions overlap usually concentrate more volume.
| Session | UTC (approx.) | CAT (UTC+2) | Most active currencies |
|---|---|---|---|
| Sydney | 22:00 – 07:00 | 00:00 – 09:00 | AUD, NZD |
| Tokyo | 00:00 – 09:00 | 02:00 – 11:00 | JPY, AUD |
| London | 08:00 – 17:00 | 10:00 – 19:00 | EUR, GBP, CHF |
| New York | 13:00 – 22:00 | 15:00 – 00:00 | USD, CAD |
London, New York and Sydney change their clocks for part of the year, shifting the sessions by about an hour against UTC+2. Always confirm the times in your platform's session clock.
The London open and the London–New York overlap concentrate much of the daily volume in EUR, GBP and USD pairs.
At the end of the US session and at the Sunday open, liquidity is thinner: spreads widen and prices can jump.
Fundamental analysis
Studying the economy and politics behind each currency to understand where capital tends to flow.
There are three complementary ways to look at the market:
Asks why: interest rates, inflation, growth, politics.
Asks where and when: price, trend, zones and patterns.
Asks what mood the market is in: fear or appetite for risk.
The economic indicators that matter most
| Indicator | What it measures | Common reading |
|---|---|---|
| Rate decision | The rate set by the central bank and the statement that comes with it | Higher rates or a more hawkish tone tend to support the currency |
| Inflation (CPI) | Change in consumer prices | Above forecast raises the odds of a rate hike |
| Employment (e.g. US NFP) | Job creation and the unemployment rate | A strong labour market suggests a robust economy |
| GDP | Economic growth | Growth above forecast tends to support the currency |
| PMI | Purchasing managers' expectations for manufacturing and services | Above 50 signals expansion; below 50, contraction |
The economic calendar
Economic releases have fixed dates and times. An economic calendar shows, for each event, the market forecast, the previous value and the expected impact. Check it before every session.
- Filter by the countries of the currencies you trade.
- Prioritise high-impact events.
- Watch the forecast: that is what the market will compare the actual number with.
How the market reacts to news
| Scenario | Forecast | Actual | Likely currency reaction |
|---|---|---|---|
| Upside surprise | 3.0% | 3.4% | Tends to strengthen: the market expects higher rates |
| In line | 3.0% | 3.0% | Limited reaction: it was already “priced in” |
| Downside surprise | 3.0% | 2.6% | Tends to weaken: rates may fall |
Made-up numbers. In reality, the reaction also depends on context, the central bank's message and other data released on the same day.
What happens in the minutes around big news
- Spreads widen as liquidity providers protect themselves.
- Price can jump several pips at once, and your stop loss may fill at a worse price than set (slippage).
- The first move isn't always the real one: price often goes one way and reverses minutes later.
For beginners, the most prudent approach is to have no open positions in the minutes before and after high-impact events, or to cut the position size significantly.
Risk sentiment
Beyond each country's data, the market alternates between phases of risk appetite (risk-on) and risk aversion (risk-off).
Economic optimism. Currencies linked to growth and commodities, such as AUD and NZD, tend to gain strength.
Fear or crisis. Capital seeks refuge in currencies such as USD, CHF and JPY.
Fundamental analysis helps define the context: which currencies are strong or weak and why. Technical analysis, in the next chapter, helps decide where to enter and exit.
Technical analysis
Reading price behaviour on the chart to identify the trend, key zones, and entry and exit points.
Technical analysis starts from a simple idea: price reflects the decisions of every participant, and that behaviour tends to leave patterns that repeat. It does not predict the future with certainty; it helps organise decisions around probabilities.
The Japanese candlestick
Each candle summarises price movement over one period (1 minute, 1 hour, 1 day…). It shows four prices: open, high, low and close.
What candles tell you
One side dominated the period with conviction.
Price reached an extreme and was rejected. Useful near important zones.
Indecision: buyers and sellers in balance.
Always read candles in context. A rejection candle in the middle of nowhere means little; the same candle at a support zone, in the direction of the trend, means much more.
Trend and market structure
Price rarely moves in a straight line. It advances in waves, leaving highs and lows behind. The sequence of those points defines the market's structure.
| Structure | Sequence | Reading |
|---|---|---|
| Uptrend | Higher highs and higher lows (HH + HL) | Buyers in control; look for buys on pullbacks |
| Downtrend | Lower highs and lower lows (LH + LL) | Sellers in control; look for sells on pullbacks |
| Range | Highs and lows around the same levels | Balance; price oscillates between limits |
Breaks and changes of structure
When price closes above the last high in an uptrend, it confirms continuation (many traders call this a BOS, break of structure). When, instead, it breaks the last relevant low, it is the first sign that the trend may be changing (CHoCH, change of character).
Analyse a higher timeframe first (for example, 4 hours) to define the main trend, and only then drop to a lower timeframe (15 minutes, 1 hour) to look for the entry. Trading with the higher-timeframe trend is usually simpler for beginners.
Support and resistance
Support is a zone where demand has been strong enough to stop declines. Resistance is a zone where supply has stopped rallies. Treat them as zones, not exact lines: price rarely respects a level to the pip.
How to mark useful zones
- Start on a higher timeframe (4 hours or daily): zones visible there matter more.
- Look for areas where price reversed several times or left with force.
- Draw a band covering the candle bodies and part of the wicks, rather than a single line.
- Keep only a few zones: the two or three closest to current price are enough.
After resistance breaks with conviction, it often acts as support when price comes back to it, and vice versa. That retest is one of the most studied entry scenarios.
- Wait for confirmation at the zone (rejection, close)
- Place the stop on the other side of the zone
- Combine the zone with the higher-timeframe trend
- Entering just because price “reached” the line
- Cluttering the chart with lines
- A stop glued to the zone, where noise hits it
Styles and strategies
There is no single right strategy for everyone. There is the one that fits your time, temperament and capital.
Choose your style
| Style | Trade duration | Screen time | Profile |
|---|---|---|---|
| Scalping | Seconds to minutes | Very high | Fast decisions; costs (spread) weigh heavily |
| Day trading | Minutes to hours, closed the same day | High | Availability during the active sessions |
| Swing trading | Days to weeks | Medium | Compatible with a job; patience to wait |
| Position trading | Weeks to months | Low | Focus on fundamentals; tolerates large swings |
For beginners: swing trading and day trading on 1-hour charts or higher are usually easier to learn, because they give you more time to think and the spread weighs less.
What every strategy needs to define
The conditions in which the strategy works: trend, range, session, pair.
The concrete, verifiable signal that gets you in.
Where the idea is invalidated. It is set before entering.
Where to take profit and how to manage the trade until then.
Write each point so that someone else following your plan would make the same decision. The three models on the next page are starting points for study, not ready-made systems or a guarantee of results.
Three models to study
| Context | A clear uptrend on the higher timeframe (rising highs and lows; price above the moving average). |
| Entry | Price pulls back to a support zone or to the average; enter after a rejection candle that closes in the trend's direction. |
| Stop | Below the low of the pullback. |
| Target | The last high, or at least twice the stop distance (R:R 1:2). |
| Context | Price stuck between support and resistance for several candles. |
| Entry | A clear close outside the zone; wait for price to return to the broken zone and confirm there. |
| Stop | On the other side of the broken zone. |
| Target | The range height projected from the breakout, or the next relevant zone. |
| Context | Price reaches an important higher-timeframe zone after an extended move. |
| Entry | Only after signs of exhaustion (long rejection wick) and a structure break on the lower timeframe. |
| Stop | Beyond the extreme reached at the zone. |
| Target | The middle of the previous move or the opposite zone. A riskier model: use a smaller position. |
Before using any model with real money
- Backtest: scroll back through the chart and log every signal, entry, stop and result.
- Demo test: at least 30 to 50 live trades on a demo account, with the same rules.
- Evaluate: win rate, average R:R, longest losing streak and largest account drawdown.
- Start small: move to real money at minimum risk and only scale up after months of consistency.
Risk management
The most important chapter in this guide. You can be wrong about direction many times and stay in the game, as long as every mistake is small.
The 1% rule
A rule used by many traders: never risk more than 1% (2% at most) of your account on a single trade. “Risk” means the loss you take if the stop loss is hit, not the size of the position.
| Losses in a row | Account risking 1% per trade | Account risking 10% per trade |
|---|---|---|
| Start | 1,000 USD | 1,000 USD |
| 5 losses | 951 USD | 590 USD |
| 10 losses | 904 USD | 349 USD |
Table 9.1 — Each loss is calculated on the current balance. Streaks of 5 to 10 losses happen even with good strategies.
How to calculate position size
- Account: 1,000 USD. 1% risk = 10 USD.
- Entry at 1.0850 and stop at 1.0830: a distance of 20 pips.
- Pip value on one standard lot of EUR/USD: 10 USD.
- Calculation: 10 ÷ (20 × 10) = 0.05 lot (5 micro lots).
- Check: 0.05 lot = 0.50 USD per pip. 20 pips × 0.50 = 10 USD. ✓
The stop is defined by your analysis, where the idea is invalidated. The lot size adjusts to that stop so the loss is always the same amount. Never tighten the stop just so you can open a bigger lot.
Risk-reward and win rate
The risk-reward ratio (R:R) compares what you risk with what you expect to gain. With a higher R:R, you need to be right less often to avoid losing money.
| R:R | Break-even win rate* |
|---|---|
| 1:1 | 50% |
| 1:1.5 | 40% |
| 1:2 | 33.3% |
| 1:3 | 25% |
* Formula: 1 ÷ (1 + R). Before costs (spread, commission, swap). A high R:R alone is not enough: the target must be realistic for that market.
Recovering from a loss is harder than it looks
| Account drawdown | Gain needed to get back to the start |
|---|---|
| −10% | +11.1% |
| −20% | +25% |
| −30% | +42.9% |
| −50% | +100% |
| −75% | +300% |
Types of stop loss
Beyond a low, high or zone. The most logical: it sits where the idea stops making sense.
Based on ATR, for example 1.5 × ATR. Adapts to the market's pace.
Follows price in your favour to protect profit. Use it with rules, not on impulse.
Gaps and loss limits
A gap is a price jump with no trading in between, common at the Sunday reopen or after strong news. In those cases your stop may be filled at the first available price, worse than the level you set. So:
- Avoid holding large positions over the weekend.
- Reduce size around high-impact events.
- Prefer smaller positions with wider stops over large positions with tight stops.
Daily and weekly limits
Besides the risk per trade, set limits for the whole:
| Limit | Example rule | Why |
|---|---|---|
| Per trade | Maximum 1% of the account | No single trade takes you out of the game |
| Daily | Stop after −3% on the day | Avoids emotional decisions after losses |
| Weekly | Stop after −6% on the week | Forces a pause to review the plan |
| Total exposure | Maximum 3% at risk at the same time | Controls correlated positions |
Reference values. Adjust them to your profile and keep them in writing.
Risk checklist before every trade
- I know exactly where my stop loss is and why.
- I sized the lot to risk no more than 1% of the account.
- The target offers at least the R:R set in my plan.
- There is no high-impact news in the next few minutes.
- I have no other open position adding the same risk.
- I haven't hit my daily or weekly loss limit.
- I would calmly accept losing this amount.
Move your stop loss further away as price approaches it, “average down” on a losing position without a plan, or increase the lot to win back a loss. These are the three habits that destroy the most accounts.
Practise lot sizing and stop placement on every trade, without risking real money.
Psychology and trading plan
A good strategy without discipline produces poor results. A plan turns intention into repeatable behaviour.
The most common emotional mistakes
Immediately opening another, bigger trade to “win back” a loss. Antidote: a mandatory break after hitting the daily limit.
Trading out of boredom or anxiety, without a valid signal. Antidote: a maximum number of trades per day.
Jumping late into a move that has already run. Antidote: only enter on your plan's triggers.
Closing at the first profit and letting losses run. Antidote: target and stop set before entering.
Your trading plan on one page
| Section | Fill in with… |
|---|---|
| Markets and hours | Which pairs you trade and in which sessions (e.g. EUR/USD and GBP/USD, 10:00 to 18:00 UTC+2). |
| Strategy | Context, trigger, stop and target, written as verifiable rules. |
| Risk | % per trade, daily and weekly limits, maximum exposure. |
| Routine | Economic calendar, marking zones, end-of-day review. |
| Stop rules | When you stop trading (limits hit, fatigue, news). |
The trading journal
Log every trade: date, pair, direction, entry, stop, target, lot, result, a chart screenshot and the reason for entering. After a few weeks, the journal reveals patterns your memory hides, such as the hours when you lose most or the rules you break most often.
Judge yourself on the quality of execution (did you follow the plan?) rather than the result of a single trade. A well-executed trade can lose; a poorly executed one can win by luck.
How to choose a broker
Your broker holds your money and executes your orders. Choosing well is a safety decision, not just a price decision.
The criteria that matter
| Criterion | What to check |
|---|---|
| Regulation | Which of the broker's entities will serve you and which regulator supervises it. Confirm the licence number on the regulator's own website. |
| Costs | Typical spreads on the pairs you'll trade, commissions, swaps and inactivity, deposit or withdrawal fees. |
| Deposits and withdrawals | Methods available in your country, timeframes, minimums and whether the account holder's name must match. |
| Platforms | Stability, mobile version, order types and charting tools. |
| Client protection | Segregated client funds, negative balance protection, stop-out conditions. |
| Customer support | Available channels, hours and language. Test it with a question before depositing. |
| Demo account | Lets you test the platform and execution without risk. |
Some well-known regulators
United Kingdom
Australia
Cyprus (EU)
Malta (EU)
South Africa
Germany (EU)
The level of protection varies a lot between regulators and countries. Many brokers have several entities: the one that serves you depends on the country where you live.
Red flags
- Promises of guaranteed or “risk-free” profit.
- Account managers pressuring you to deposit more.
- Requests to trade for you using your password.
- Difficulty or surprise fees when withdrawing money.
- No clear information about regulation.
The broker Blue Mode uses: Deriv
At Blue Mode we use and recommend Deriv. It is the broker we work with every day and the one our tools and lessons are built for.
- Free demo account to practise without risk
- Forex and other markets in the same account
- Web and mobile platforms
- Online account opening
- Which entity and regulator apply to your country
- The deposit and withdrawal methods available
- The spreads and leverage conditions of your account
- The risk warnings published by Deriv itself
Conditions, regulation and available products vary by country and may change. Always confirm the current information on Deriv's official website.
Open an account in 4 steps
- Click the link below and create your account with email or Google.
- Start with the demo account: it comes with a virtual balance to practise everything you've learned.
- Verify your identity when you want to move to a real account (ID document and proof of address).
- Only deposit what you can afford to lose and apply the risk rules from chapter 9 from your very first trade.
Start on a demo account, with no commitment.
t.deriv.link?t=32ALGTJYUJCW
Deriv's products are complex derivatives and are not suitable for everyone. You may lose some or all of the capital you invest. Never trade with borrowed money or money you cannot afford to lose.
Your first 30 days
A simple plan to move from reading to practice, without rushing and without risking money too early.
- Reread chapters 2, 3 and 9.
- Open a demo account and explore the platform.
- Calculate the pip value on 3 different pairs.
- Pick 2 major pairs and stick with them.
- Mark the trend and zones on the 4-hour chart every day.
- Follow the economic calendar.
- Choose one of the models from chapter 8.
- Write your rules and your trading plan.
- Backtest it on 20 to 30 examples.
- Trade on demo using only your rules.
- Size each trade to risk 1%.
- Log everything in your journal and review at the end of the week.
Keep trading on demo until you have at least 30 to 50 trades logged while following the plan. Only then consider moving to real money, at minimum risk, and treat the first months as a continuation of your training.
Create your free demo account and follow the plan step by step.
FAQ
Frequently asked questions
How much money do I need to start?
To learn, none: start on a demo account. For a real account, the right amount is what you can lose without affecting your life. With small accounts, use micro lots so you can respect the 1% risk rule.
Can you make a living from Forex?
Some traders make Forex their main source of income, and that can be your goal too. The path starts with building consistency: learning on demo, following a plan, managing risk well and growing your account step by step. Every month of disciplined practice brings you closer to that goal; see this stage as an investment in your education.
What is the best pair for beginners?
Major pairs such as EUR/USD and GBP/USD usually have low spreads and plenty of information available. More important than the pair is sticking to a few and getting to know them well.
What is the best timeframe?
To start with, 1-hour to 4-hour charts give you time to think. Use the daily or 4-hour chart to define the trend and a lower timeframe only to refine the entry.
Do I need a stop loss on every trade?
Yes. Without a stop, a single trade can wipe out months of results. Setting the stop before entering is the basis of every risk calculation.
Do signals and indicators guarantee results?
No. No indicator, signal or tool guarantees a profit. They are ways to organise your analysis; the result depends on execution, risk management and market conditions.
How long does it take to learn?
The concepts in this guide can be learned in weeks. Consistent execution usually takes many months of deliberate practice and journal review.
Can I trade from my phone?
Yes, most brokers have apps. A bigger screen helps for analysis and planning; the phone is handy for monitoring and managing trades.
Keep this page
Guide summary
Forex is decentralised, highly liquid and driven by interest rates, inflation, the economy and risk sentiment.
Master pips, lots and pip value. Without them you don't know how much you are risking.
It doesn't change the pip value; it changes how much of the account each position represents.
Favour the active sessions and avoid open positions during high-impact news.
Structure, zones and few indicators, always read in context.
1% per trade, always a stop, a calculated lot, daily and weekly limits.
Checklist before every trade
- The higher-timeframe trend is identified
- Price is at a zone marked in advance
- My plan's trigger has happened
- Stop at the point where the idea is invalidated
- Lot sized for 1% risk
- R:R equal to or above my plan's
- No imminent high-impact news
- Trade logged in the journal
In trading you don't control the result of each trade. You control how much you risk, when you enter and whether you follow your plan. That is where your energy should go.
Open your free demo account and use this checklist on every trade.
Volume 2 · Blue Mode educational series
Next step: Smart Money Concepts (SMC)
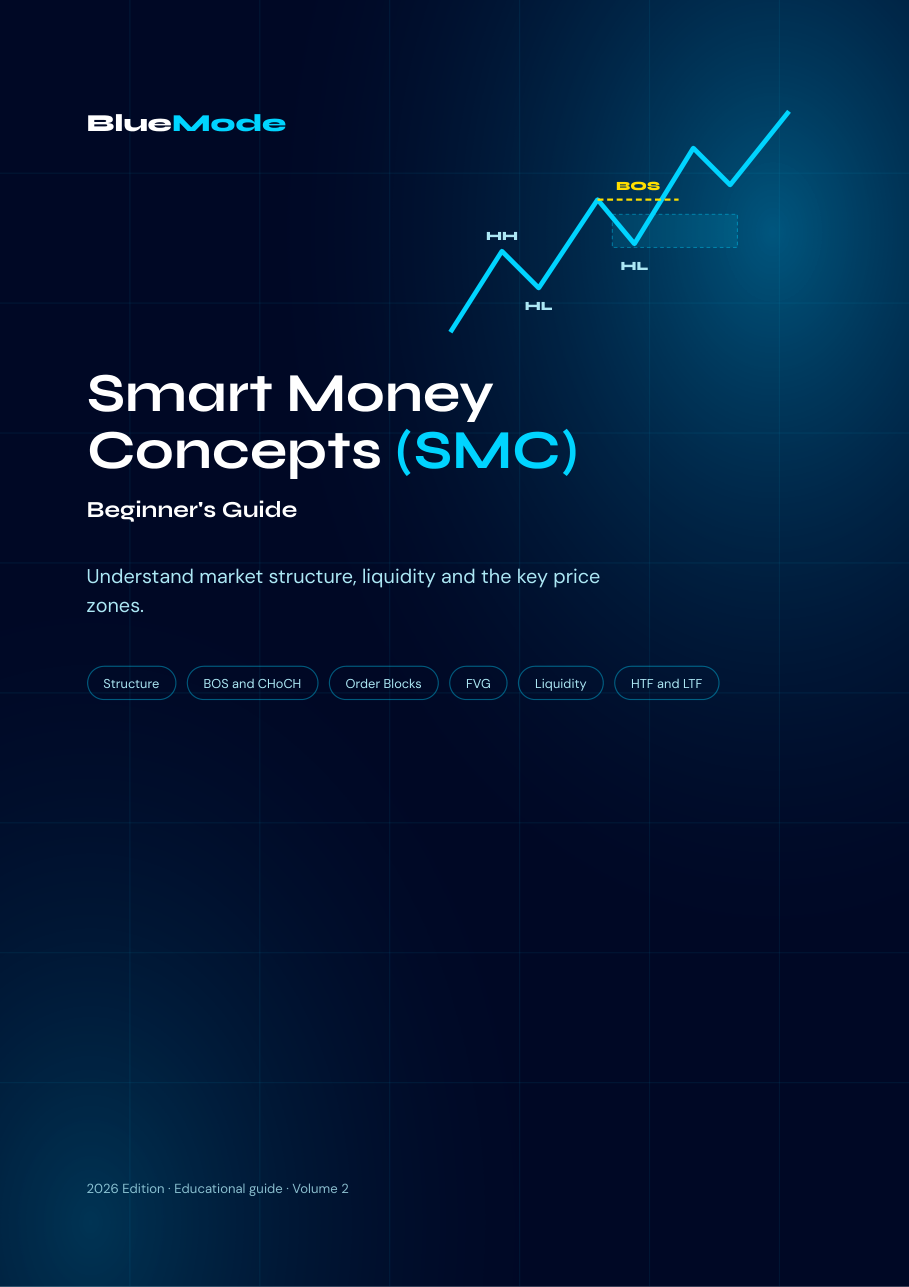
The second guide in the series introduces the vocabulary and chart concepts most used by the SMC community, with simple explanations and illustrative diagrams.
- Market structure
- BOS
- CHoCH
- Order Blocks
- FVG
- Liquidity
Next steps
You have finished the guide. Now what makes the difference is consistent practice, with clear rules and controlled risk.
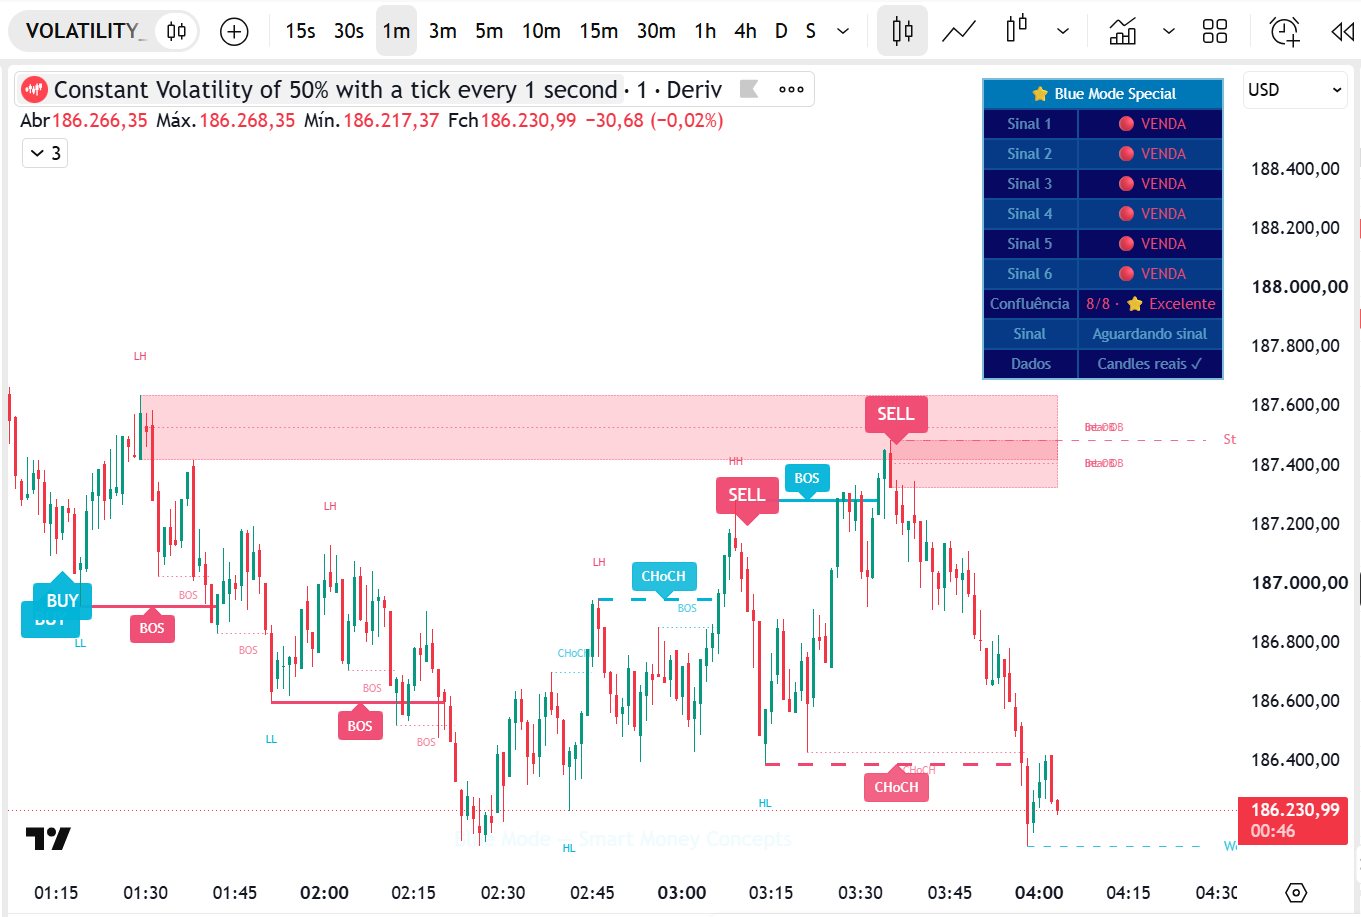
Join the free channel to follow educational content, analysis and community updates.
Join the channel →See how the Blue Mode indicator organises chart reading.
global.bluemode.site →© 2026 Blue Mode. Educational guide; not financial advice. Trading Forex and CFDs carries a high risk of loss and may not be suitable for everyone.