Before you start
About this guide
This is the second volume of the Blue Mode educational series. After “Forex for Beginners”, we present the vocabulary and chart concepts most used by the Smart Money Concepts community.
For anyone who already knows the Forex basics (candles, pips, trend, support and resistance) and wants to understand terms such as BOS, CHoCH, Order Block or FVG.
It is not an advanced course or a complete trading strategy. It is an introduction to reading a chart with these concepts and thinking critically about them.
How to read the highlights
Extra explanations and context.
Good practice for applying the concepts with more judgement.
Limitations, common mistakes and risks.
Trading Forex and CFDs carries a high risk of loss. This guide is educational, not financial advice: only trade with money you can afford to lose.
Introduction to Smart Money Concepts
An organised way of reading the chart through structure, liquidity and price zones.
What SMC means
Smart Money Concepts (SMC) is the name given to a set of technical analysis ideas that became popular among retail traders. The expression “smart money” refers, in general terms, to participants with more capital and information, such as banks and large funds.
In practice, SMC organises chart reading around three questions:
Where is price going? Is the trend continuing or changing?
Where are many orders likely to be resting, such as stops above highs and below lows?
Which zones did strong moves start from, and where were imbalances left behind?
Why traders use these concepts
The chart shows thousands of candles and a lot of noise. Tools such as market structure, liquidity and price zones help to name and organise what you see: identify the direction, mark relevant areas and define, before trading, what would have to happen for an idea to become valid or invalid.
SMC and price action
SMC does not replace price action analysis (reading price movement without relying on indicators); it builds on it. Many concepts are classic ideas under a different name:
| Classic price action | Closest idea in SMC |
|---|---|
| Rising or falling highs and lows | Market structure (HH, HL, LH, LL) |
| Break of a high or low | BOS (continuation) or CHoCH (possible change) |
| Supply or demand zone | Order Block |
| Gap or very fast move | Imbalance and Fair Value Gap |
| Stops above highs and below lows | Liquidity and liquidity sweeps |
Market structure
The sequence of highs and lows is the foundation of every other SMC concept.
Swing highs and swing lows
A swing high is a point where price rises and then pulls back, forming a visible high. A swing low is the opposite: price falls, turns and forms a low. Swings are the “anchor points” you use to read structure.
How many candles are needed to confirm a swing varies: some traders use 2 or 3 candles on each side, others use their own visual reading. Pick one criterion and stick to it.
The four structure labels
| Label | Name | Meaning |
|---|---|---|
| HH | Higher High | A high above the previous high. |
| HL | Higher Low | A low above the previous low. |
| LH | Lower High | A high below the previous high. |
| LL | Lower Low | A low below the previous low. |
The labels always compare a point with the previous point of the same type: high with high, low with low.
Bullish and bearish structure
How to identify the overall direction
- Zoom out and mark only the most obvious swings. Ignore small fluctuations.
- Compare the last two highs and the last two lows. Both rising suggests bullish structure; both falling, bearish.
- If the signals are mixed (for example, lower highs and higher lows), the market may be ranging or in transition.
In a range, structure no longer gives a clear direction. Many traders prefer to wait for price to leave the range rather than force a reading.
BOS and CHoCH
Two names for structure breaks with different meanings: one suggests continuation, the other a possible change.
Break of Structure (BOS)
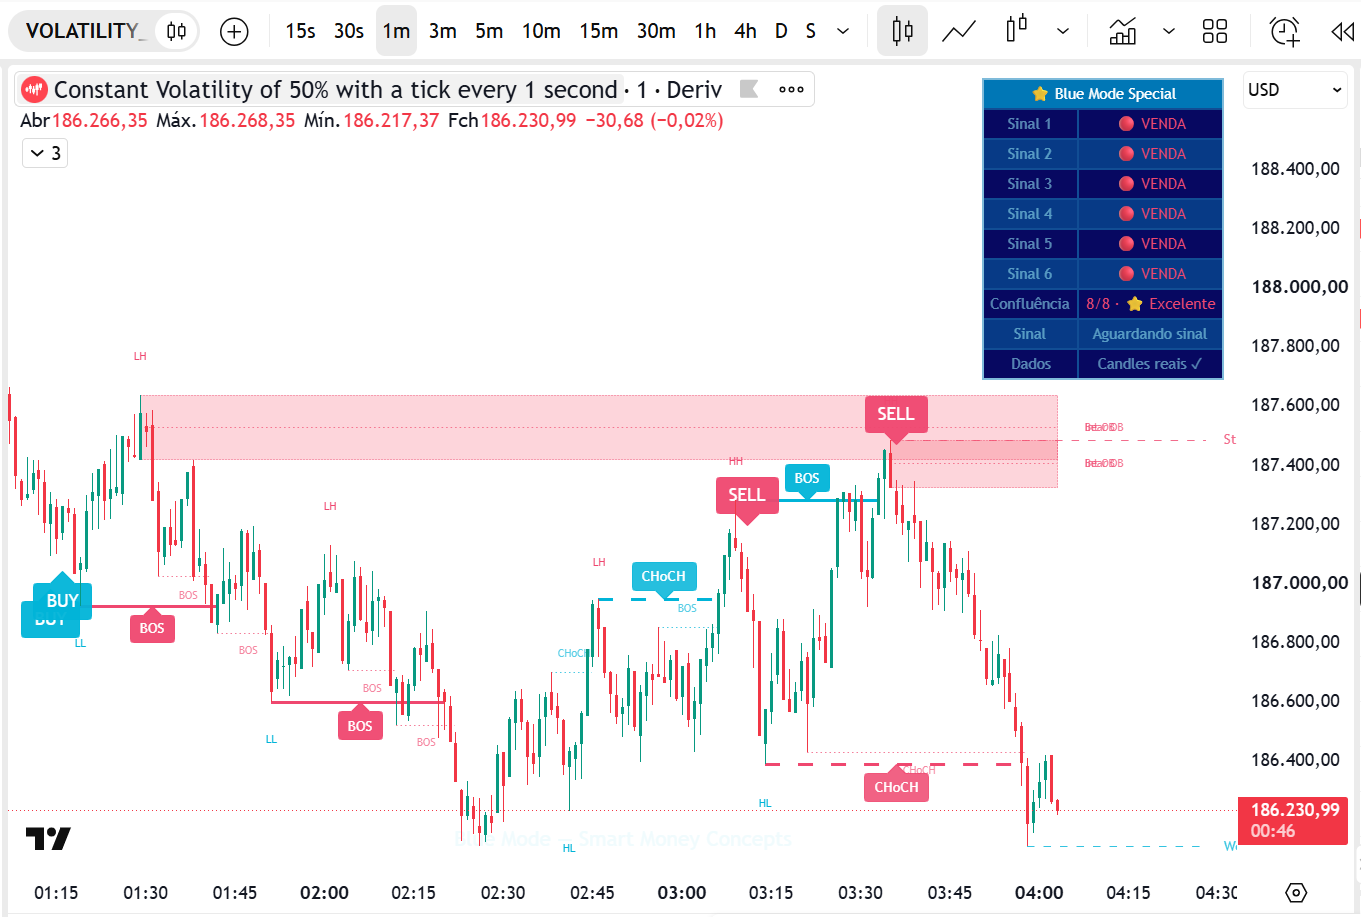
A BOS (Break of Structure) happens when price breaks a swing in the direction of the current trend:
- In bullish structure, price moves above the last high (HH) and forms a new high.
- In bearish structure, price breaks the last low (LL) and forms a new low.
A BOS is read as a sign that the trend continues.
Change of Character (CHoCH)
A CHoCH (Change of Character) happens when price breaks a swing against the current trend:
- In bearish structure, price moves above the last lower high (LH).
- In bullish structure, price breaks the last higher low (HL).
A CHoCH is read as the first sign that the trend may be changing. On its own, it does not confirm a reversal.
The practical difference
| BOS | CHoCH | |
|---|---|---|
| Direction of the break | With the trend | Against the trend |
| Swing broken | Last HH (bullish) or LL (bearish) | Last HL (bullish) or LH (bearish) |
| Common reading | The trend continues | The trend may be changing |
| Frequent mistake | Assuming the move will continue without limit | Treating the first CHoCH as a confirmed reversal |
The four cases side by side
BOS = price does “more of the same” (another high in an uptrend, another low in a downtrend). CHoCH = price breaks the last point the trend had to defend.
Closes, context and timeframe
Wick or close?
Many traders only treat a break as valid when the candle body closes beyond the swing. A wick that goes past the level and comes back is read differently: it may be a liquidity sweep (chapter 6). Others accept the wick as a break. Pick one criterion and always apply it the same way.
Context matters
- A BOS in a strong, clean trend reads differently from a BOS after a very stretched move.
- A CHoCH against a higher-timeframe trend is often just a pullback within that trend.
- Breaks during high-impact news can be sharp and reverse quickly.
The timeframe changes the reading
A CHoCH on a 5-minute chart may be just a small pullback within a BOS on the 4-hour chart. Always state which timeframe you are marking structure on. Chapter 7 develops this point.
Terminology varies
There is no official, universal definition. Some traders distinguish internal structure (small swings) from external or swing structure (larger swings); others call only the first break against the trend a “CHoCH” and the following ones “BOS”. What matters most is that your own rules are clear and consistent.
A break guarantees neither continuation nor reversal. After a BOS, price can return inside the range; after a CHoCH, the previous trend can simply resume. They are signals to analyse, not orders to enter.
Order Blocks (OB)
Zones where a strong move started and that many traders watch again when price returns.
What an Order Block is
In the most common SMC terminology, an Order Block (OB) is the last opposite candle before a strong move that breaks structure:
- Bullish OB: the last bearish candle before a strong rally that breaks a high.
- Bearish OB: the last bullish candle before a strong drop that breaks a low.
The zone is usually marked from that candle's high to its low. Some traders use only the body, or group several consecutive opposite candles.
The name “order block” comes from the idea that large participants placed orders in that zone. The chart does not prove this happened: an OB is a zone of interest defined by the trader, not a record of institutional orders.
How to identify an Order Block
- Find a strong move, with large candles in one direction, also called displacement.
- Confirm that this move broke structure (a BOS or a CHoCH). Without a break, many traders ignore the zone.
- Go back to the last opposite candle before the move and mark its range.
- Extend the zone to the right and watch whether price returns to it.
Identifying a zone is not confirming an opportunity
Marking an OB only answers “where is it worth watching price?”. A trade requires more: higher-timeframe context, a price reaction in the zone according to rules you define, a stop loss and a position size that suits your risk.
- The move that left the zone broke structure
- The zone is aligned with the higher-timeframe trend
- Price has not yet returned to the zone (a “fresh” zone)
- Zone in the middle of a range
- Many previous touches of the zone
- Zone against higher-timeframe structure
Why some zones fail
Many zones produce no reaction at all. A common invalidation criterion is price closing on the other side of the zone: below a bullish OB or above a bearish OB.
Imbalance and Fair Value Gap
When price moves so fast that it leaves untraded “gaps” on the chart.
Imbalance
An imbalance describes, in general terms, a move in which one side clearly dominates: the candles are large, consecutive and have few opposing wicks. It is the idea that price moved fast, with little two-way trading.
Fair Value Gap (FVG)
A Fair Value Gap (FVG) is a specific, measurable form of imbalance, defined with three candles:
| Type | Condition | FVG zone |
|---|---|---|
| Bullish FVG | High of candle 1 below the low of candle 3 | From the high of candle 1 to the low of candle 3 |
| Bearish FVG | Low of candle 1 above the high of candle 3 | From the low of candle 1 to the high of candle 3 |
Imbalance is the general concept (an unbalanced move). An FVG is a concrete three-candle pattern with an objective rule. Every FVG is an imbalance, but not every imbalance forms an FVG.
Bullish and bearish FVG
Revisiting or “filling” a gap
When price comes back into the FVG zone, it is said to have revisited the gap. If it crosses the whole zone, it has filled it. Some traders watch only the middle of the FVG (about 50% of the zone) as a reference.
An FVG does not have to be revisited or respected
- In strong trends, price can move away and never return to the FVG.
- Price can return and cross the zone without any reaction.
- On small timeframes dozens of FVGs appear every day; most of them are irrelevant.
An FVG is a zone of interest, not an entry signal. As with the Order Block, the decision to trade depends on context, defined rules and risk management.
Pay more attention to FVGs created by a move that also broke structure and that are aligned with the higher-timeframe trend. You can simply ignore the rest.
Mark FVGs on a live chart and watch how price reacts, without risking money.
Liquidity: EQH, EQL and sweeps
Where many orders are likely to be resting, and what happens when price gets there.
What liquidity means in trading
In general, liquidity is how easily you can buy or sell without moving price much. In SMC, the word is used mainly to describe zones where many pending orders are likely to be resting: stop losses, breakout entry orders and limit orders.
The most common places are just above previous highs and just below previous lows, because that is where many traders put their stops.
| Term | Where it sits | Orders assumed to be there |
|---|---|---|
| Buy-side liquidity (BSL) | Above previous highs | Sellers' stops and breakout buy orders |
| Sell-side liquidity (SSL) | Below previous lows | Buyers' stops and breakout sell orders |
Equal Highs (EQH) and Equal Lows (EQL)
EQH (Equal Highs) are two or more highs at roughly the same level. EQL (Equal Lows) are lows at roughly the same level. Because many traders see an obvious level there, these points are seen as areas with a lot of resting liquidity.
“Equal” is approximate: on a real chart, two highs are rarely at exactly the same price. Treat EQH and EQL as zones, with a small tolerance, not as identical prices.
Liquidity sweeps
A liquidity sweep (also called a stop run or stop hunt) happens when price briefly moves beyond a relevant high or low, triggers the orders resting there and comes back inside the level, often leaving a long wick.
Sweep or breakout?
| Sweep | Sustained breakout | |
|---|---|---|
| Candle close | Back inside the level | Beyond the level |
| Following candles | Move away from the level in the opposite direction | Continue beyond the level or retest it |
Not every wick beyond a high or low is a confirmed sweep, and a sweep is not a confirmed reversal. Price often makes a wick, pulls back and then breaks the level for good. Wait to see what happens next before drawing conclusions.
Multi-timeframe analysis: HTF and LTF
See the big picture before the details.
The two levels of reading
The larger timeframe (for example, 4 hours or daily). It defines the context: the main trend and the most relevant zones.
The smaller timeframe (for example, 15 minutes or 1 hour). It shows the detail: how price reacts when it reaches an HTF zone.
“HTF” and “LTF” are relative terms: the 1-hour chart is the HTF for someone trading the 5-minute chart and the LTF for someone analysing the daily. There is no mandatory combination; what matters is always using the same logic.
Why start with the higher timeframe
- The LTF is much noisier: BOS, CHoCH and FVGs appear all the time.
- The HTF shows which of those signals are aligned with the main direction.
- It helps you avoid trading against a larger move without noticing.
When timeframes agree or disagree
| HTF | LTF | Common reading |
|---|---|---|
| Bullish | Bullish | Aligned context; even so, nothing guarantees continuation. |
| Bullish | Bearish | May be just a pullback within the HTF trend. |
| Bullish, price in an HTF zone | Bullish CHoCH | Possible sign that the pullback is ending; needs confirmation. |
| Ranging | Any | Unclear context; many traders prefer to wait. |
An example with two timeframes
- HTF: rising highs and lows; the structure is bullish.
- HTF: price pulls back and approaches a previously marked zone.
- LTF: during the pullback, the structure is bearish (LH and LL).
- LTF: price closes above the last LH, forming a bullish CHoCH, which suggests the pullback may be losing strength.
Even with a favourable HTF, LTF signals fail often: the pullback can deepen, the HTF zone can be broken, or the CHoCH can be followed by a new low. That is why the stop loss and position size are set before entering.
Choose a fixed pair of timeframes (for example, 4 hours and 15 minutes) and keep it for weeks. Switching charts until you find the reading you prefer is one of the mistakes in chapter 9.
How the concepts connect
One reading path on a single chart, from context to price zone.
This example shows how a trader might look at the chart using the concepts in this guide. It is not a complete strategy or a setup that always works. On real charts, each step is more ambiguous than here.
The path step by step
- Overall structure. The move on the left is bullish and forms a high (HH). The next question is: is the pullback that starts here just a pause or a change?
- Swing and liquidity area. Roughly equal lows (EQL) form during the pullback. Below them there is likely sell-side liquidity (SSL), such as buyers' stops.
- Possible sweep. A candle wicks below the EQL and closes back above. It may be a liquidity sweep, but on its own it confirms nothing.
- Possible CHoCH. A strong move closes above the high of the pullback. In the short-term structure, this is a bullish CHoCH, consistent with the larger trend.
- Price zones. The strong move left an Order Block (the last bearish candle before the rally) and an FVG. When price returns to these zones, the trader can watch them, without assuming they will hold.
6. Context, risk and independent confirmation
Even when steps 1 to 5 look aligned, the decision to trade still requires:
- HTF context consistent with the idea.
- Written entry rules of your own, applied the same way every time.
- A stop loss set before entry, at a level where the idea is invalidated.
- Position size calculated to risk a small part of the account (for example, 1%).
- Attention to the economic calendar and high-impact news.
SMC concepts help you choose where to look. Risk management, explained in volume 1 (“Forex for Beginners”), is what protects you when your reading is wrong, and that will happen often.
Common beginner mistakes
The habits that most confuse your reading and most hurt your account.
If everything is a zone, nothing is. Require a strong move that breaks structure before you mark an Order Block.
Most FVGs, especially on small timeframes, are irrelevant. Filter them by context.
A wick beyond a level does not confirm a change of direction. Wait for the structure that follows.
Before naming it, ask: what trend am I in, and which swing was broken?
An LTF signal against the HTF is often just a pullback. Always start with the context.
Jumping from chart to chart until you find the reading you want is confirming your opinion, not analysing.
No method guarantees results. SMC is a way of reading the chart, and it often fails.
Set your stop loss, risk per trade and daily loss limit in advance. Without them, one mistake can be costly.
Practise marking structure, OBs, FVGs and liquidity on past charts and on a demo account, and record in your journal what worked and what failed. Consistency comes from repetition with clear rules.
Conclusion
The essentials of the guide in one place.
Guide summary
HH and HL define an uptrend; LH and LL define a downtrend. It is the starting point for everything.
A BOS breaks with the trend; a CHoCH breaks against it. Neither guarantees what comes next.
Zones of interest left by strong moves. Watch them; do not assume them.
EQH, EQL and previous highs and lows concentrate orders. A sweep is not a confirmed reversal.
The higher timeframe gives the context; the lower one gives the detail. Always use the same combination.
The concepts show where to look. Your stop loss and position size protect you when you are wrong.
Keep learning
SMC concepts only make sense with practice. Mark structure, zones and liquidity on past charts, test your rules on a demo account and record everything in a journal. Progress step by step, with patience and with risk management always first.
Next steps
You have finished the second volume of the series. Now what makes the difference is practising with clear rules and controlled risk.
Join the free channel to follow educational content, analysis and community updates.
Join the channel →See how the Blue Mode indicator organises chart reading.
global.bluemode.site →Practise everything you've learned on a demo account, without risking real money.
Open account →© 2026 Blue Mode. Educational guide; not financial advice. Trading Forex and CFDs carries a high risk of loss and may not be suitable for everyone.